View your revenue report
See how much your shop earns each day, and which products and categories bring the money in.
On this page
Cà Phê Sài Gòn has been open a few days, and the sales are adding up. Now Minh wants to know the numbers - how much the shop takes each day, and what’s actually selling. BANA records every completed sale for you, so the answer is already waiting in two places: your dashboard, for the quick daily pulse, and the Report app, for the detail.
Before you start
- You’ve made at least one sale on the POS - see Make your first sale. The report only counts completed orders.
- You’re signed in to the dashboard at client.bana.com.vn as the owner.
Read the day at a glance
Open your dashboard
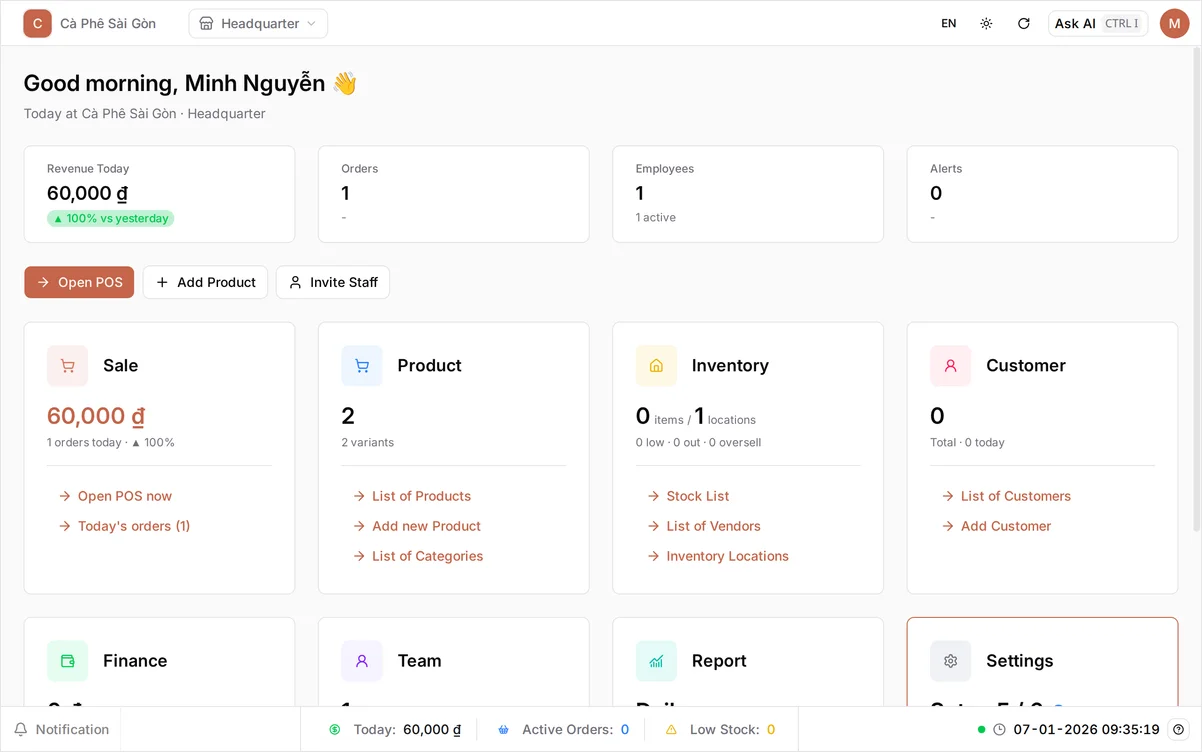
When you sign in, the dashboard opens on your shop overview. The Revenue Today card at the top shows what you’ve taken so far today and how that compares to yesterday. The Sale card lower down repeats today’s revenue with the order count beside it. This is your pulse before you dig into the detail - if the number looks right, the day is on track.
Open the revenue report
Open the Report card on the dashboard (or pick Report from the app switcher in the top-left). It opens on Revenue → By Day. Choose a period with Today, Last 7 days, Last 14 days, or Last 30 days, or set your own dates on the right. The summary cards show Total Orders, Gross Sales, Net Sales, and Avg Order Value for that period - the café gave no discount and added no tax on its first sale, which is why its gross and net read the same; the Daily Sales Trend chart plots them day by day; and the Daily Sales Details table underneath gives one row per date, with tax and discount broken out. After the café’s first sale the cards read one order and 60,000 ₫.
Tip: Gross sales is the total before discounts and tax; net sales is what’s left after them - the figure closest to what the shop really earned.
On a phone: every view here is readable, but the summary cards and the detail tables keep their desktop widths, so the amounts clip at the edge - scroll sideways to read a figure in full.
See which products sell best
Select By Product in the sidebar. The Top 10 Products by Gross Revenue chart ranks the period’s sellers, and the Product Details table below lists each one’s Quantity Sold, Gross Revenue, Net Revenue and Returns - so the café’s sale shows Cà phê sữa đá at 35,000 ₫ and Bánh mì thịt at 25,000 ₫, one of each. This is how you learn which menu items earn their place - and which ones to rethink.
See which categories sell best
Select By Category. The Revenue Share by Category donut splits the period between your menu groups - Đồ uống (Drinks) took 58.3% of the café’s takings and Đồ ăn (Food) the rest - and Category Details lists the same split as figures. Categories that sold nothing in the period still appear, at 0 ₫, including the starter groups BANA created with your store, so a long list of zeros just means those groups had no sales that day. Switch the date range here too. There is no side-by-side view, so to compare a quiet Monday with a busy weekend you pick one range, read it, then pick the other.
What the report tells you
| Where to look | Question it answers |
|---|---|
| Dashboard → Revenue Today | How much have I taken today? |
| Report → By Day | How is revenue trending across the week or month? |
| Report → By Product | Which items bring in the most money? |
| Report → By Category | Do drinks or food drive my sales? |
Every figure comes straight from completed sales - there is nothing to enter by hand. A sale shows up the moment it closes on the POS, though a page you already had open needs a refresh to pick it up.
What’s next
You can now read your numbers any time. From here:
- Track stock and locations - keep the products behind these numbers in stock.
- Record income and expenses - the money that never passes through the till.
- Revisit Make your first sale to add the day’s takings.
You’re all set - your numbers are always one click away.
Frequently asked questions
Why does my report say there is no data?
The report only counts completed sales for the dates you pick. If you made no sales in that period - or you're looking at the wrong dates - it shows 'No data for the selected period.' Make a sale or widen the date range.
What is the difference between gross sales and net sales?
Gross sales is the total before discounts and tax adjustments. Net sales is what is left after them - the figure that reflects what the shop actually earned.
Does the report update right after a sale?
Yes. The moment a sale is completed on the POS, it appears in the report and on your dashboard. If you already have the page open, refresh it.
What are the other entries in the Report sidebar?
Depending on your plan you may also see By Shift, Ledger and a Support Center group. They are separate reports and helpdesk tools; the three revenue views in this guide are the ones most shops read daily.